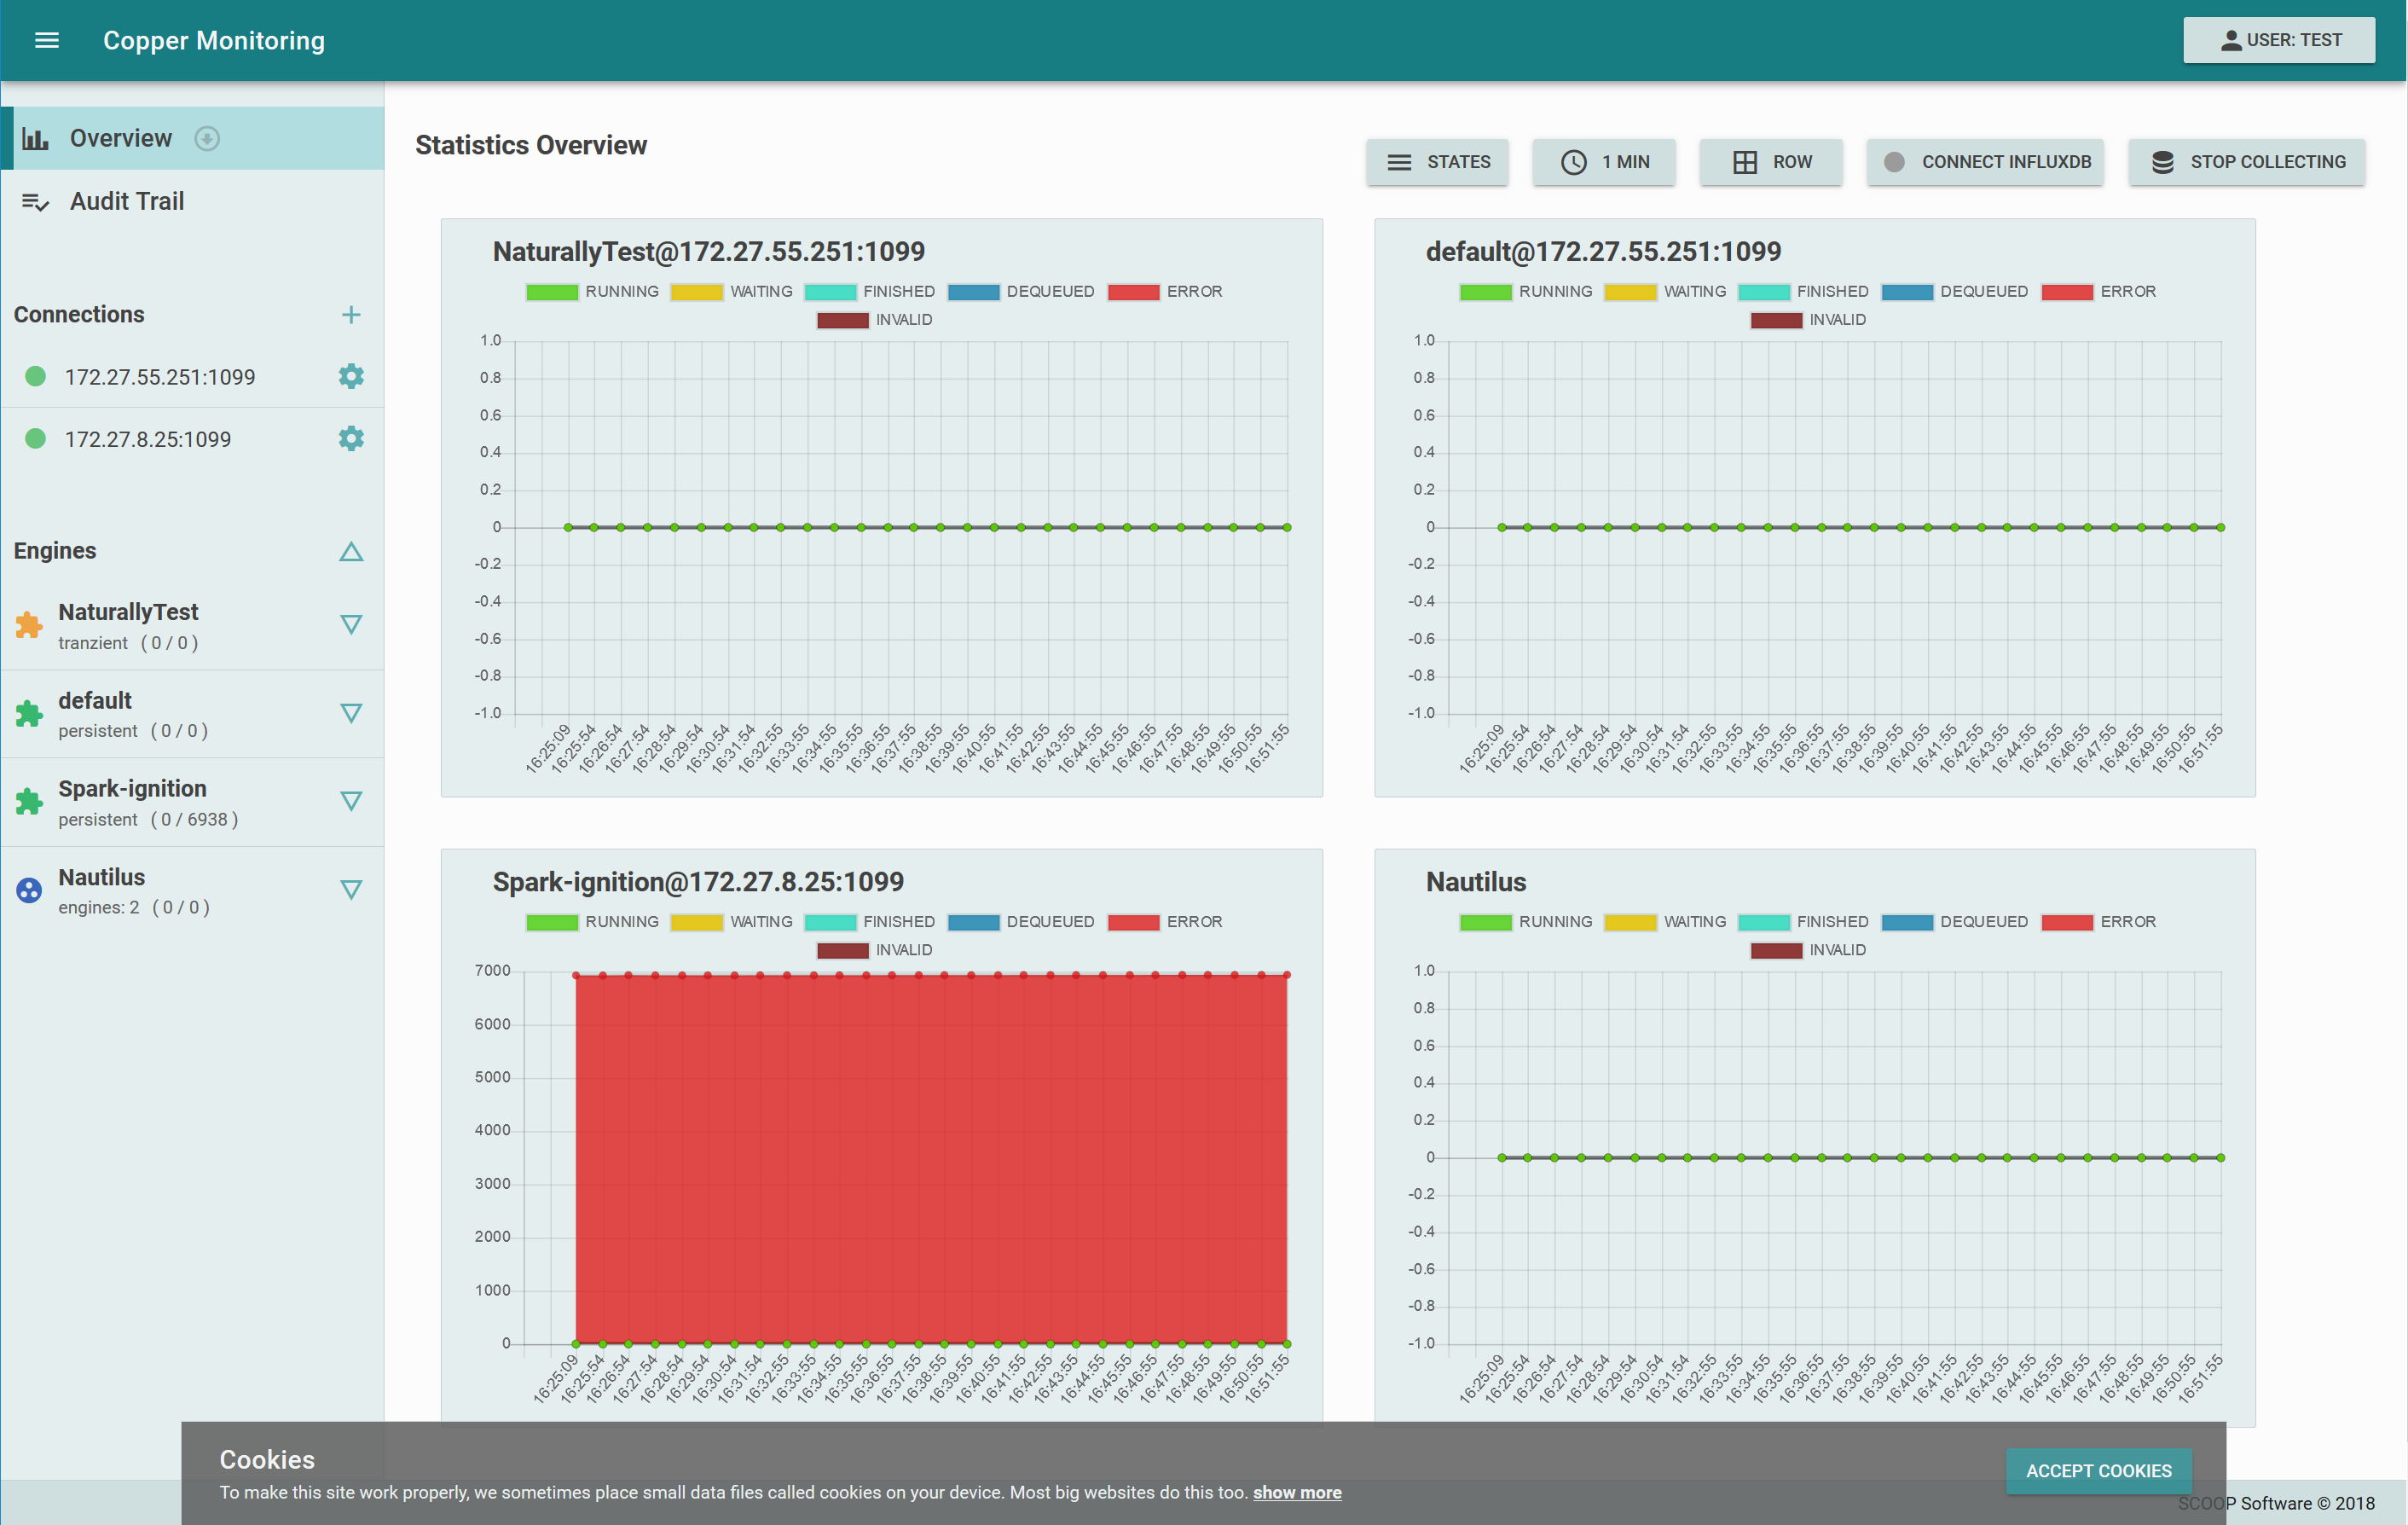
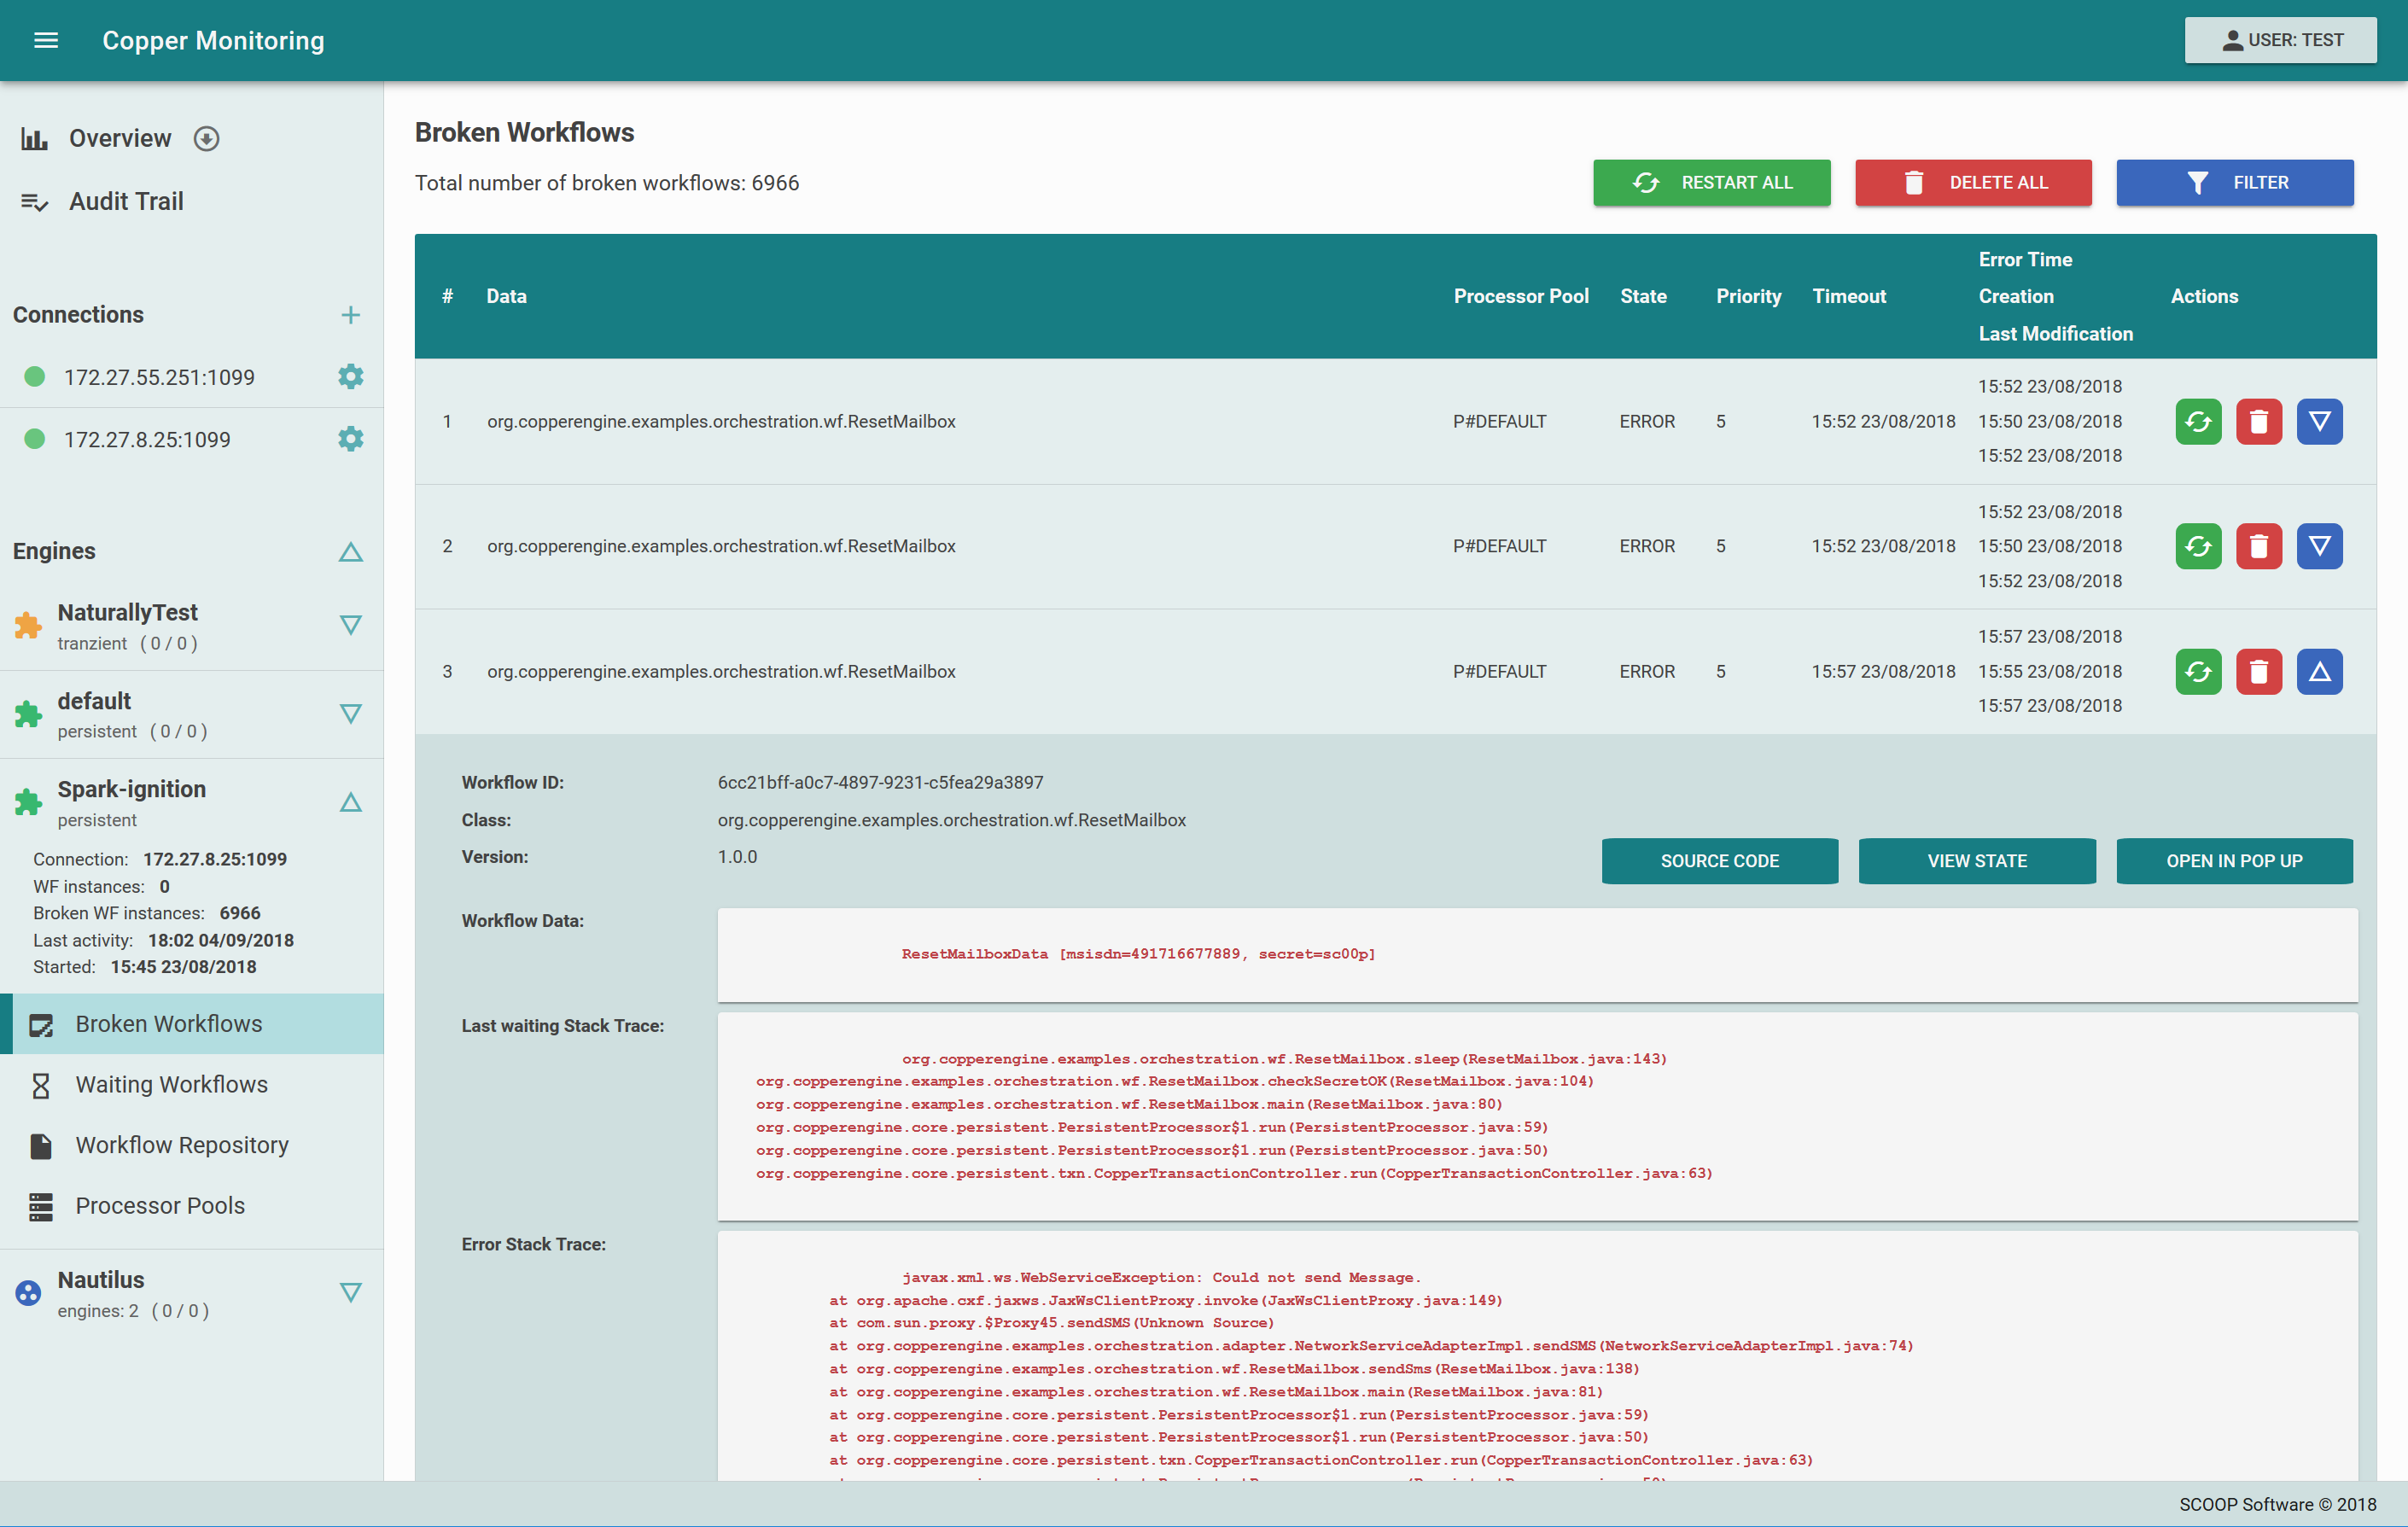
Checkout the new monitoring UI for COPPER 5.0
With the recent release of COPPER 5.0 , we not only upgraded COPPER to run with Java 9+ and make proper use of the new module system, but we also developed a totally new monitoring UI based on modern web techniques (SPA with Vue.js). In this blog post, we would like to demonstrate the new UI, give you simple hands-on setup and useage instructions, and highlight the key features. We’ll further want to give you some background decisions on why the things are developed the way they are.

There is a dedicated reason for us to not just use a standard (metrics) monitoring tool for monitoring a COPPER engine: We not only want to visualize metrics, but also provide the user some highly COPPER specific data (i.e. workflow related state data) and give the user the possibility to directly act on monitored events, i.e. let him perform some control-operations. In our day-to-day useage of COPPER in many projects, we often have workflows like this: “Get some information synchronously and quickly from microservice A, with that response, get some additional information from system B”. Now service A goes down or slightly changes its response/API unexpectedly which causes some of our workflows to fail and go into an error state internally. What we want to do in operations now: We see that a lot of workflow are broken due to the outage from service A and once service A is up again, we want to restart all affected workflows to redo their requests.
With the new monitoring UI, we can do just that. We are able to see a list of all broken workflows and are able to inspect each of those. We can see the Java stacktrace of the broken expression, we can check out the serialized workflow data object and - if the file based workflow repository was used - get the source code of the workflow visualized in the monitoring UI all along with highlighting the relevant lines of code for the current situation. We can further just issue a broken workflow (or a set of workflows defined by a matching filter) to be reenqued and thus rerun from the last wait position.
The monitoring UI of course also offers some visualization of important metrics, just to make operations a bit easier.
From an architecture perspective, we
- want the COPPER engine to keep a minimal library footprint and especially don’t want the engine to remember metrics by itself.
- want to be open to any other monitoring / operations solution and not specifially bound the user to our new monitoring UI.
- want the monitoring UI to be strictly separated from the engine.
The last point needs some special attention here. In business environments, we usually have a highly secured setup where the application running COPPER engine is not accessible from outside. The monitoring UI, on the other hand, should be open to any operator to be able to get monitoring information at any time from anywhere. Of course, the monitoring UI needs to meet standard security pattern so that not anyone else can control the workflows, but that was self-evident in the UI development. To come back to the point, usually monitoring UI and copper engine need to run on different hosts. With our distributed engine setup, this point becomes even more apparent. We want to have one monitoring UI running, showing the state of all involved engines within the application.
In order to support a wide variety of monitoring and operation tools, COPPER engine always exposed its metrics and some operations via JMX. In our monitoring UI setup, we plugin to the existing JMX, put Jolokia as a connector in between and are thus able to access the JMX operations securely via REST method invocation, only requiring the JMX port to be available from outside the engine host. The monitoring UI can run on a less restrictive network which has JMX access to the copper host and which is avaiable e.g. from a corporate reverse nginx proxy or similar.
If the user visits the monitoring UI, the application will start to gather monitoring data (remember: historical data is not stored in COPPER!) and keep it for the user in order to visualize statistics in graphs over time. But as the user usually wants to visualize not the current state of the system but want to inspect historical patterns (Like: Why did the system crash last night?), there is a small tutorial included in the UI on how to setup a metrics database so that the COPPER JMX metrics are continuously gathered and put into a metric store. In our example setup, we make use of the InfluxDB TICK stack (namingly telegraf to export JMX metrics and InfluxDB as storage engine). Our monitoring UI can be adjusted to visualize the metrics not from the browser local store but to query InfluxDB and thus show historic values as well, where the user didn’t have the browser opened.
We definitely don’t want to replace existing monitoring environments with the new UI. Each customer has different setups and tools in use and we don’t want to build up a fully suitalbe monitoring solution here. We encourage you to use tools like InfluxDB for storing metrics, Graphana for proper visualization in all granularities and setup alarm rules and events in there. But if you for instance received an alarm or an unexpected behaviour or if you are in development, the UI is the place where you quickly get a more detailed overview with workflow states, do a better problem analysis and be able to perform certain actions like workflow deletion or reenqueing.
But enough for the reasoning and architecture, let’s just get our hands on. Assuming you already have a copper engine running, starting the monitoring UI is as simple as
docker run -p 8080:8080 copperengine/copper-monitoring
The copper engines to connect to can be setup from within the UI and by each user on its own. You can, however, as well set up some default connections via environment variables so that a new user already has some engines pre setup, specific for the project to be monitored. Same goes for standard UI user/password and a possible InfluxDB connection. If you run the UI, keep in mind that you engine must be in a 5.0+ version as for the UI to work, some minor but important changes to the engine had to be made.
Et voila, you can now checkout the features of the new UI yourself. For a fully detailed setup and technical description, just visit the source repository and checkout the README.md file. After all, copper-monitoring is Open Source and licensed via Apache 2.0, same as the copper engine.

If you don’t have docker installed or you currently don’t have time to check out the UI yourself, we’d like to close the article with a feature list.
- Get the overhead view of your application:
- Real-time statistics visualized
- Number of active/broken workflows per engine
- Workflow details and interaction
- Audit Trail display
- Workflow Repository display
- Processor Pool display
- Broken Workflows ( with state of ERROR or INVALID )
- Display details ( with stacktrace ) of broken workflows
- Display error and last wait Strack Traces
- Display source code of the workflow ( with highlights on the last waiting line and error line )
- Display the workflow’s deserialized state
- Open workflow in pop-up window
- Filter workflows by class name, state or created and modification date
- Restart broken workflows ( one, filtered or all )
- Delete broken workflows ( one, filtered or all )
- Waiting Workflows ( with state of WAITING )
- Display details ( with stacktrace ) of waiting workflows
- Display source code of workflow ( with highlights on the last waiting line and error line )
- Display last wait Strack Traces
- Display the workflow’s deserialized state
- Open workflow in pop-up window
- Filter workflows by class name or created and modification date
- Delete waiting workflows (one, filtered, or all )
- Workflow Repository info
- Display type, source, and last build results of the repository
- Display list of classes within the repository and their details
- Display source code of the repository classes
- Processor Pools info
- Display processor pool statistics
- Processor pool actions: Resume, Suspend, Resume Deque and Suspend Deque
- Audit Trail
- Filter audit trail based on time, log level, class, id, etc.
- Collect and show Statistics for all engines
- The GUI can collect statistics and store them in Local Storage, but only while the page is running in a browser
- The GUI can alternatively give a user custom generated settings to use with Telegraf and Influx DB so that statistics can be collected continuously.
- Statistics will be visualized in real-time from either data source